The AI Underwriting Framework: Extended
Position, performance, and the tests I've added

The 7 Powers tell you whether a company should be defensible. They don't tell you whether it works. A company can hold proprietary data in a regulated vertical, deep integration, and a founding team who ran the workflow they're automating, and still be routing a tenth of its customers' volume with a person checking every output. The framework assesses position. It has nothing to say about performance, and in this cycle performance is what has been separating the outcomes.
Hamilton Helmer’s 7 Powers is still the clearest framework I know for separating durable businesses from well-timed ones, and I’ve written at length about how the seven operate in this cycle. The limitation is structural rather than analytical. Every power is defined against competitors inside a known industry: scale economies are cost advantages over a defined set, counter-positioning is asymmetry against a named incumbent, switching costs are measured against the alternatives a customer could plausibly move to. Each presumes a stable answer to what business this company is in.
In AI that boundary moves every few months and it moves one way. Your supplier becomes your competitor. Your category gets absorbed by the model providers. What you sell becomes a checkbox in a product you don’t control. Assess a company’s powers against the market as it stands at the point of investment and you have assessed a market that may not survive the deployment.
Helmer’s own framing points at the fix. He built 7 Powers on top of Michael Porter’s industry analysis of Competitive Advantage, and the two do different jobs: Porter’s five forces explain why some industries are structurally more profitable than others, 7 Powers explains why some companies hold a durable position inside one. Structure first, then position. In SaaS you could skip the first step, because the structure was stable and broadly favourable across the whole category. In AI you can’t. My investment lens now incorporates a blend of both Helmer and Porter to cover each basis.
This article is an extension to some of my previous work, and surfaces my views on additional frameworks that can help investors classify high quality companies in the age of AI. Below are two articles I wrote previously that help frame this article, both of which I’d recommend reading:


1. Where the Profit Settles
Porter's argument, published in 1979 and largely unimproved on since, is that industry profitability is set by five forces: the bargaining power of suppliers, the bargaining power of buyers, the threat of substitutes, the threat of new entrants, and the intensity of rivalry among existing competitors. Where the forces are weak, participants keep their margin. Where they're strong, margin flows to whoever holds the leverage. It's a worse framework than 7 Powers for assessing a single company and a much better one for establishing where in a chain the gross profit ends up.
Start with supplier power, because it has changed most and SaaS investors have no instinct for it. In the SaaS era supplier power was close to dead. Compute was a commodity, three hyperscalers competed for the same workload on price, and no supplier had either the ability or the incentive to ship your product. An application company’s cost of goods was a line item it could negotiate down and largely ignore.
That condition has reversed completely. A handful of labs supply the core input. The input isn’t fungible at the top of the capability range, whatever a model-agnostic architecture diagram claims. And the supplier ships into your category on its own release schedule, using the usage data your customers generate, with distribution you can’t match. No software cohort has faced supplier power like this.
Buyer power has risen for a reason with no precedent in enterprise software: your input costs are published. When inference pricing drops, the buyer reads the same page you do and arrives at renewal expecting the saving. A SaaS company’s cost structure was opaque and its pricing was set by value delivered. An AI application company’s cost structure is a matter of public record, which drags price toward cost in every negotiation where the buyer has an alternative.
The threat of substitution comes from upstream. For a thin application layer the substitute is the frontier model with a longer context window, a better tool-use loop and native access to the same systems of record. Every capability release is a substitution event for somebody. Rivalry and new entry can be taken together, because they share a cause: the barrier to launching a competent application-layer product is the lowest it has been in the history of software.
The same forces that squeeze the application layer protect the layers above it, which is the uncomfortable half of the analysis. At the model layer scale economies are close to absolute - training frontier models is prohibitively expensive below massive scale, which is a barrier to entry denominated in tens of billions of dollars. Brand accrues there for the reason brands always accrue where buyers can’t cheaply evaluate, which is why enterprise procurement asks which lab rather than which benchmark. At the infrastructure layer, Nvidia’s CUDA position is the cornered resource I described in November and it hasn’t weakened. Both layers hold pricing power because the layer below has nowhere to go and the layer above has no leverage.
Application companies therefore compete in the least structurally attractive position in the chain. That isn’t an argument against backing them. It’s an argument that the ones worth backing must be doing something the structure doesn’t do for them, and the name for that is foreclosure - the company holds something a competitor can’t hold, so the buyer has nowhere else to take the business.
2. Which Powers Survive
Reading the seven powers back through that structure re-ranks them. Three of my prior positions survive intact for reasons I didn’t fully state at the time, and three need revising.
Branding. In November I wrote that I had underestimated brand. In May I corrected myself, and the correction was right: brand is the compound interest of doing everything else right, the output of a defensible business rather than the input. The structure explains why. Brand works by removing the need to evaluate, and the AI buyer evaluates - a procurement process that ends in a measured accuracy figure on the buyer’s own data is one where reputation buys the pilot and nothing more. Where brand does accrue is upstream, at the layer where buyers cannot cheaply test what they’re buying.
Scale economies. I previously said the thing to watch is the direction of gross margin as revenue scales rather than the current level, and that margins compressing with scale signal a structural problem growth won’t fix. That’s correct and it’s the input of a test I’ll set out in the next section. What I’d add is where the power actually lives. Inference cost at the application layer is close to linear in volume. Serving the ten-thousandth customer costs roughly what the hundredth cost. An application company can still get cheaper per customer as it grows, but through falling deployment cost rather than falling unit cost, and that's process power rather than scale economics.
Network economies. My previous article already carries the litmus test and the correct distinction: a data loop where more usage improves the model is not a network effect where more users make the platform more valuable for each participant. Both worth having, not the same thing. What it left unfinished is the test. I wrote that a flywheel described in a deck is a hypothesis and a flywheel with specific evidence of the loop operating is a moat, and then defined the evidence as the founder being able to walk you through it. That tests whether the founder can describe the loop, not whether it's running. The measurable version comes later.
Then, three powers I believe become more valuable in this structure, not less.
Cornered resource is the strongest position available at the application layer, and in this market it means something narrow: a licence, a team, an exclusive channel, or a decision dataset already in hand rather than one that arrives if the company executes. I previously claimed that the founding team can itself be a cornered resource where domain knowledge is deep enough that it can’t be hired in. I'd extend that rather than withdraw it. Deep domain teams remain the strongest signal I see at seed, and the question I've added is whether their judgement is being encoded into something the company owns. Expertise that lives only in people is expertise the company rents.
Counter-positioning I identified this as the power that generates the most genuine excitement, with Service-as-Software against seat-based SaaS as the example. That still holds and I’d now argue it’s the most reliable power to underwrite for early stage companies, for a reason I didn’t give at the time: it’s a fact about the incumbent’s accounts rather than a forecast about the startup’s execution. An incumbent with a seat-based revenue base cannot move to outcome pricing without destroying the revenue its valuation rests on. The test from November still works - if this company succeeds, why wouldn’t the incumbent copy it? An answer of “because it would hurt them” is worth underwriting. An answer of “because we execute faster” is far less durable.
Switching costs survive and need splitting. The Salesforce and Bloomberg cases are migration-pain moats: the cost of leaving is the cost of moving data and retraining people. In May I identified the better kind - proprietary data trained into the model, where leaving means losing the compounding advantage the data represents. What I didn’t say is how to tell them apart in a company that has neither yet, and the failure mode isn’t the one you’d expect. It isn’t that the data is thin. It’s that the accumulated value sits in the customer’s cleaned-up knowledge base rather than in the vendor’s system, which produces migration pain that looks identical from the outside and transfers to nobody.
Process power has changed character rather than weight. In May I described it as the systematic loop of deployment, feedback capture, retraining and integration improvement, which is right and still abstract. It has a concrete form: the machinery for evaluating output, absorbing model releases without shipping regressions, and driving deployment cost down per customer. It’s the least glamorous thing in the company and the power most likely to still be there in five years.
One thing has changed about how the powers combine. Previously I noted that a company rarely holds all seven and that a few can be enough. That was true where advantage decayed slowly. In this market single powers get competed away and overlap becomes more important. Chris Hohn built a public-market record on only backing businesses with several barriers operating simultaneously, on the grounds that any single barrier eventually fails. Applied to AI it’s less a test of what a company holds than of whether its choices are mutually reinforcing or merely co-located.
3. The Position Tests
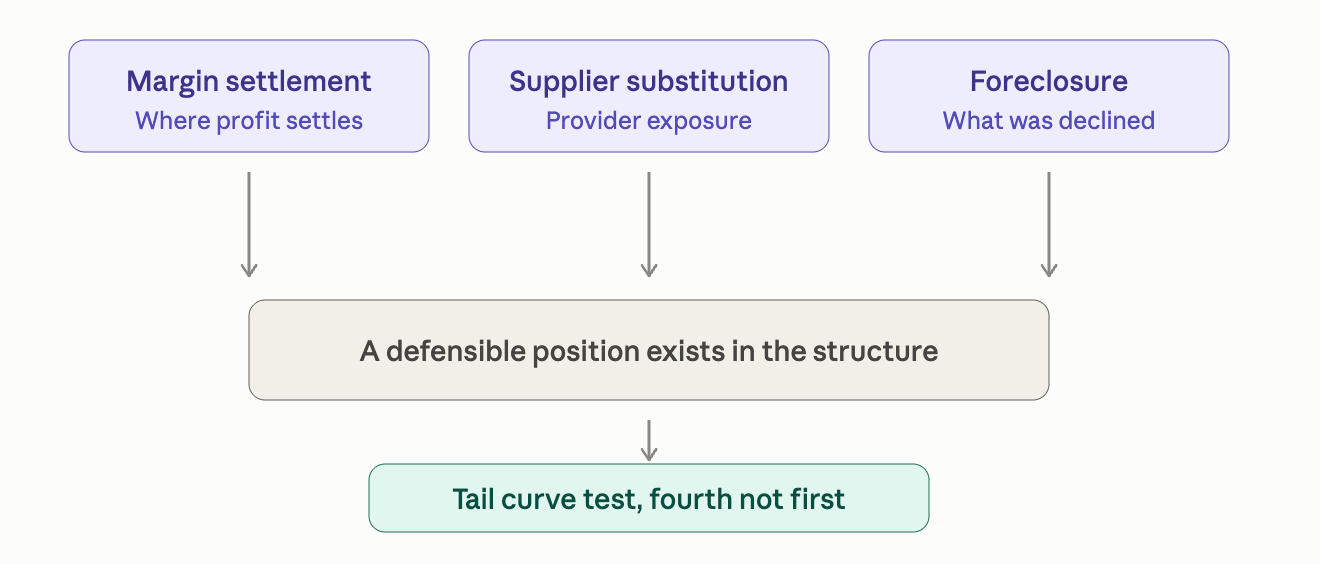
Five forces determined where profit settles. The next question is what that means for a specific company sitting in a specific place in the chain, and it produces three tests I now run before anything else. Each asks the same underlying thing from a different angle: has this company done something that stops the margin flowing past it to the buyer or up to the supplier?
They run first because a company that fails all three has no position worth diligencing at any price. That demotes the Tail Curve Test to fourth. Its three questions are unchanged - can the entry price support a 100x, is the market deep enough, is a 10x base case achievable without heroics - but a company sitting where gross profit doesn’t settle has no 20x path at any entry price, so pricing one is wasted work.
The Margin Settlement Test. Where does gross profit settle in this value chain, and does this company sit there? The arithmetic version, which I now run in a first meeting: take a company at £2m ARR with inference at eighteen per cent of revenue. Gross profit is roughly £1.6m before support costs. Scale to £20m holding that ratio and gross profit is £16m, of which £3.6m has gone to the model provider. Now run it with inference costs down ninety per cent, which is the direction of travel. The provider’s take falls to £360k, and the customer’s expectation of your price has fallen too, because they read the same pricing pages you do. The question isn’t whether your margin improves. It’s whether you keep the difference or hand it to the buyer. A company with a foreclosed position keeps it. A company on the frontier gives it away, because every competitor’s costs fell on the same day.
The Supplier Substitution Test. What share of revenue goes to the model provider, is that share falling, and what happens when the provider ships this natively? A failing answer sounds like “we’re model-agnostic, so we’re not exposed.” A strong one sounds like “one provider is sixty-one per cent of COGS, down four points a quarter as we route more volume to smaller models, and if they shipped this tomorrow the customer would still be buying our permissions model and our audit trail.”
The Foreclosure Test. Foreclosure means shutting a door. One segment, one deployment model, one level of autonomy — and giving up the customers who needed something else. That commitment is what lets a company build things a broader competitor can't justify. Which of segment, model dependency, autonomy and deployment surface has this company actually foreclosed? A failing answer is that it serves mid-market and enterprise across financial services, healthcare and legal, is model-agnostic, and offers both cloud and on-premise. Four non-decisions presented as flexibility. A strong answer names something declined and the revenue it cost. Think of this test as having a clear, intense customer oriented focus.
4. The Production Tests
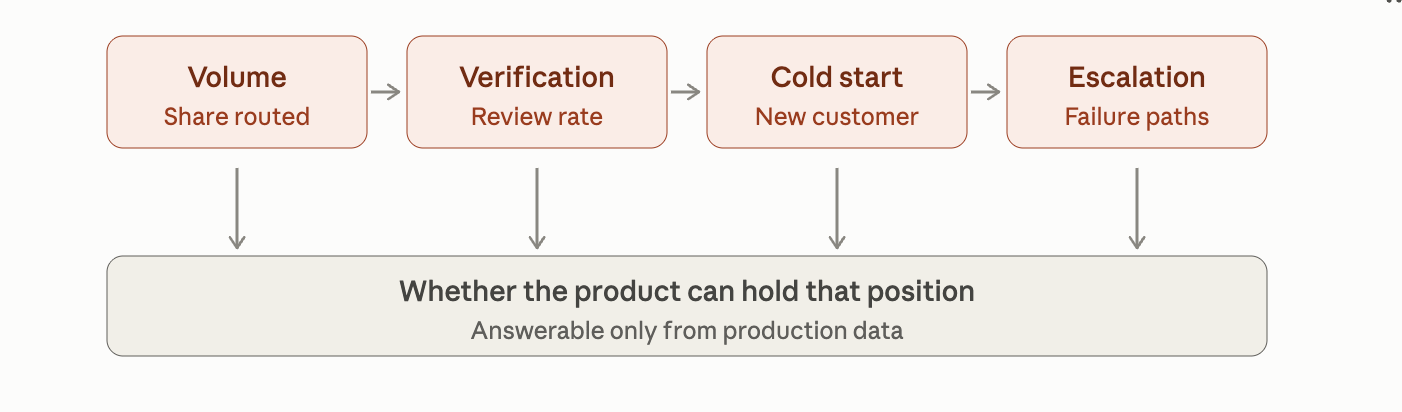
Three diligence tests carry over that I covered previously: Deployment Architecture, Model Improvement, and Agentic Compatibility. I still run all three on each deal I look at. They share a limitation, and it’s the same one the powers framework has.
Every one is answerable from a conversation. Deployment Architecture asks how many systems the product touches, who signs off, and what breaks at removal, which measures how hard it would be to leave without asking whether the customer is using it at volume. Model Improvement asks whether a better base model compounds the proprietary layer or absorbs it, which presumes a proprietary layer exists and is doing something. Agentic Compatibility asks about position in a stack that mostly hasn’t been built. All three are structural questions, and structure is knowable in advance. Whether a probabilistic system performs reliably enough inside one customer’s process is knowable only from production data.
That gap is where I’ve spent time thinking about. A company clears every structural test - proprietary data in a regulated vertical, real integration depth, a founding team with domain history, a credible path to becoming the system of action - and then you look at what the product does inside a customer and it’s running a fraction of the contracted volume, with a person checking almost every output, on an accuracy plateau nobody can explain. The moat is real. The product isn’t yet doing the work.
Four additional test I came up with help close it. All of them exist inside the company already, or their absence is the finding.
The verification ratio. What share of output receives human review, tracked by cohort over time rather than blended. Two companies can make identical claims here and run different businesses. Take document classification, where doing the task takes eight minutes and checking the answer takes thirty seconds: with every output reviewed, that workflow still removes 94% of the labour. Now take contract review, where doing it takes ninety minutes and checking it properly takes fifty-five, because a reviewer who hasn’t read the contract can’t responsibly approve an analysis of it. Same architecture, same 100% review rate, and 39% of the labour removed. Price the second at 30% of a displaced £45,000 salary across a team of forty and you’re charging £540,000 against a saving the customer won’t find in its payroll.
The mechanism nobody prices runs against the vendor. Verification cost falls more slowly than production cost, because verification requires the expensive person - a junior can’t sign off a partner’s judgement. As the system absorbs routine volume, the residual review concentrates in the hardest cases and therefore the most expensive labour in the process. A company that has moved from reviewing 100% of output to 20% has not cut its customer’s verification cost by 80%, and the renewal is priced off the cost base rather than off the ratio. Some floors are permanent and correct: a clinician signs the note, a partner signs the advice, a compliance officer signs the filing. That caps the value the company can deliver and therefore the price it can hold, and the failure is pitching past it instead of pricing into it.
Every founder will tell you the review rate is falling. Ask for the number at month three and month eighteen for the same cohort, and for what caused each step down. An honest answer names the mechanism - a class of cases moved from review to auto-execute once the error rate on it was demonstrated below a threshold agreed in writing with the customer. A weak answer is a figure blended across all customers, which conceals the newest deployments dragging the average up while nothing improves underneath.
The Volume Test. Every AI deployment has two numbers. The first is the contract. The second is the share of the customer’s eligible workload that actually routes through the system. Ask for the second one.
The gap between them is structural. Deployments start against a carved-out subset of a process, because that’s the only way to go live quickly, and the subset gets chosen for being tractable. Expanding means taking on the cases that were deliberately excluded — where being wrong is expensive, or where the client’s own policy overrides the standard rule. Those cases are rare, individually strange and expensive to gather data for, which is why the last stretch of a deployment costs more engineering than everything before it.
Two readings, opposite valuations. Low and rising is a wedge working outward, which is what land-and-expand looks like before it reaches revenue. Low and flat across four quarters means the deployment hit the boundary of what the product can handle, and the volume left over is the volume it can’t take. A company at £2m ARR across ten customers each routing ten per cent of eligible work is either sitting on £20m of expansion inside its existing base or holding a £2m ceiling it hasn’t recognised. Same ARR, same growth, same logos, tenfold difference in terminal value, nothing on the P&L to separate them.
Read volume against growth rate, because the two should move together. ARR tripling while workload share stays flat means every point of growth is a new logo starting where the last one did, and the company is outrunning a ceiling rather than raising it.
The contract says which one the customer believes. A multi-year commitment at current volume means the buyer has priced the expansion and paid for the option. Annual renewal means they haven’t, and the vendor carries that risk alone.
The Cold Start Test. Ask what a brand new customer gets on day one, and whether that number has moved in two years.
The data flywheel is the most claimed and least examined moat in AI. More customers generate more data, the model improves, better product wins more customers. The claim is nearly always unfalsifiable as stated, so the test looks for a number that can only move if the loop is real.
Only one thing here counts as a moat: the vendor learned something about the problem that carries to the next customer. A failure mode gets diagnosed at customer three, generalised, and built into the product so customers four through fifty never hit it. That is the loop the flywheel claim actually describes, and it is the only version that produces an asset the company owns rather than work the customer did.
Which is why the measurement is day one for a new customer rather than the curve for an existing one. A company that signed its first customer in 2024 at 60% should be starting customers well above that today, because two years of watching the same failures recur in the same vertical is exactly the raw material a flywheel converts into product. If a new customer still starts at 60%, every customer’s improvement stayed with that customer. Deployment time by cohort says the same thing earlier, because reusable work shows up as speed before it shows up as accuracy.
That distinction decides what the retention number is worth, and the strongest companies produce both halves at once. A customer who spent six months making their process legible to a machine is genuinely locked in, which is a real switching cost and worth having. It just belongs to that one relationship. The flywheel is the other half: the same work, generalised, so the vertical’s recurring failure modes end up in the product and every subsequent customer starts further along. One holds the customers you have. The other lowers the cost of the next hundred.
The Escalation Test. Every system built on a probabilistic model meets cases it can’t handle. What happens next is a design decision, and it’s the one that determines whether anything in the deployment compounds.
There are three answers. The system doesn’t know it failed, and a wrong output goes out looking like a right one. It knows and hands the case to a person with nothing attached, so the human starts from the beginning. Or it knows, hands over with its reasoning and the specific thing it was uncertain about, and the resolution comes back in as a labelled case.
Only the third adds tangible value. Silent failure sets a permanent floor under the verification ratio, because a customer who can’t tell which outputs to trust has to check all of them, and no amount of accuracy improvement changes that. Escalation without context caps the labour saving at the difference between doing a task and doing it twice. Escalation that returns its resolution is the only version where the hardest cases the system encounters become cases it can handle next time, which is the mechanism a cold start curve needs to actually be a curve.
So the question is what the system knows about its own uncertainty and what it does with a resolved escalation. A demo answers the first part in about ninety seconds - ask to see a case it gets wrong, and watch whether it flags it or asserts it. The second part is a diligence question with a specific answer: how many escalations were resolved last month, how many of those entered the training or evaluation set, and who decided the correct answer. Practising domain experts adjudicating means the judgement is being captured in a form the company owns. Engineers working from documentation means it’s being encoded from rules a competitor can read too.
A company that can’t tell you how many escalations it resolved last month isn’t collecting them, which means the most valuable data the system generates is leaving through the support queue.
Final Thoughts
Every test in this piece has a shelf life. The verification ratio matters because verification is expensive, and it stops mattering the moment a model can be trusted to check its own work in a domain where being wrong is costly. Cold start assumes deployment carries a learning cost, which holds until a model arrives that walks into a customer already competent. I’d guess three years on some of them and considerably less on others, and I’d rather be specific about that than pretend I’ve written something durable.
The vocabulary is being rebuilt across the stack. Silicon is being measured in intelligence per watt. Inference serving has split into tokens per second per user and tokens per second per megawatt, because interactivity and throughput trade against each other and no single figure holds both. Capability is increasingly tracked by the length of task a model completes reliably rather than by benchmark score. At the application layer, cost per resolved ticket has started to displace cost per seat as the number that decides whether a business works. None of these were standard three years ago. Each exists because someone needed to answer a question the previous generation of metrics couldn’t.
The environment rewards one skill above the others, and it isn't pattern recognition. It's having the honesty, rigour and mental plasticity to adapt your framework in real-time as the market continues to evolve. I hope the following framework proves useful, and I will continue to share my updated framework periodically, as and when it evolves.